RME Digicheck
The ultimate secret weapon for high-resolution audio measurement processes
DIGICheck is a unique tool designed to test, measure and analyze digital audio streams. The software is largely self-explanatory. However, a detailed online help is provided. DIGICheck works parallel to any other software and can currently display all input data. DIGICheck is provided free of charge to all owners of an RME audio interface!
These tools are currently available:
- Two channel level meter
- Multi-channel level meter
- Global Level Meter
- Spectral Analyzer
- Vector Audio Scope
- Surround View
- Surround View w. R 128
- R 128 Loudness display
- Bit statistics and noise
- Frequency measurement
You won't find a connection to other audio applications here. But don't worry, the loopback function of the RME interfaces can be used to establish connections to the outputs. This lets you analyze the signals of other applications on the same computer.
DigiCheck NG only works with RME devices.
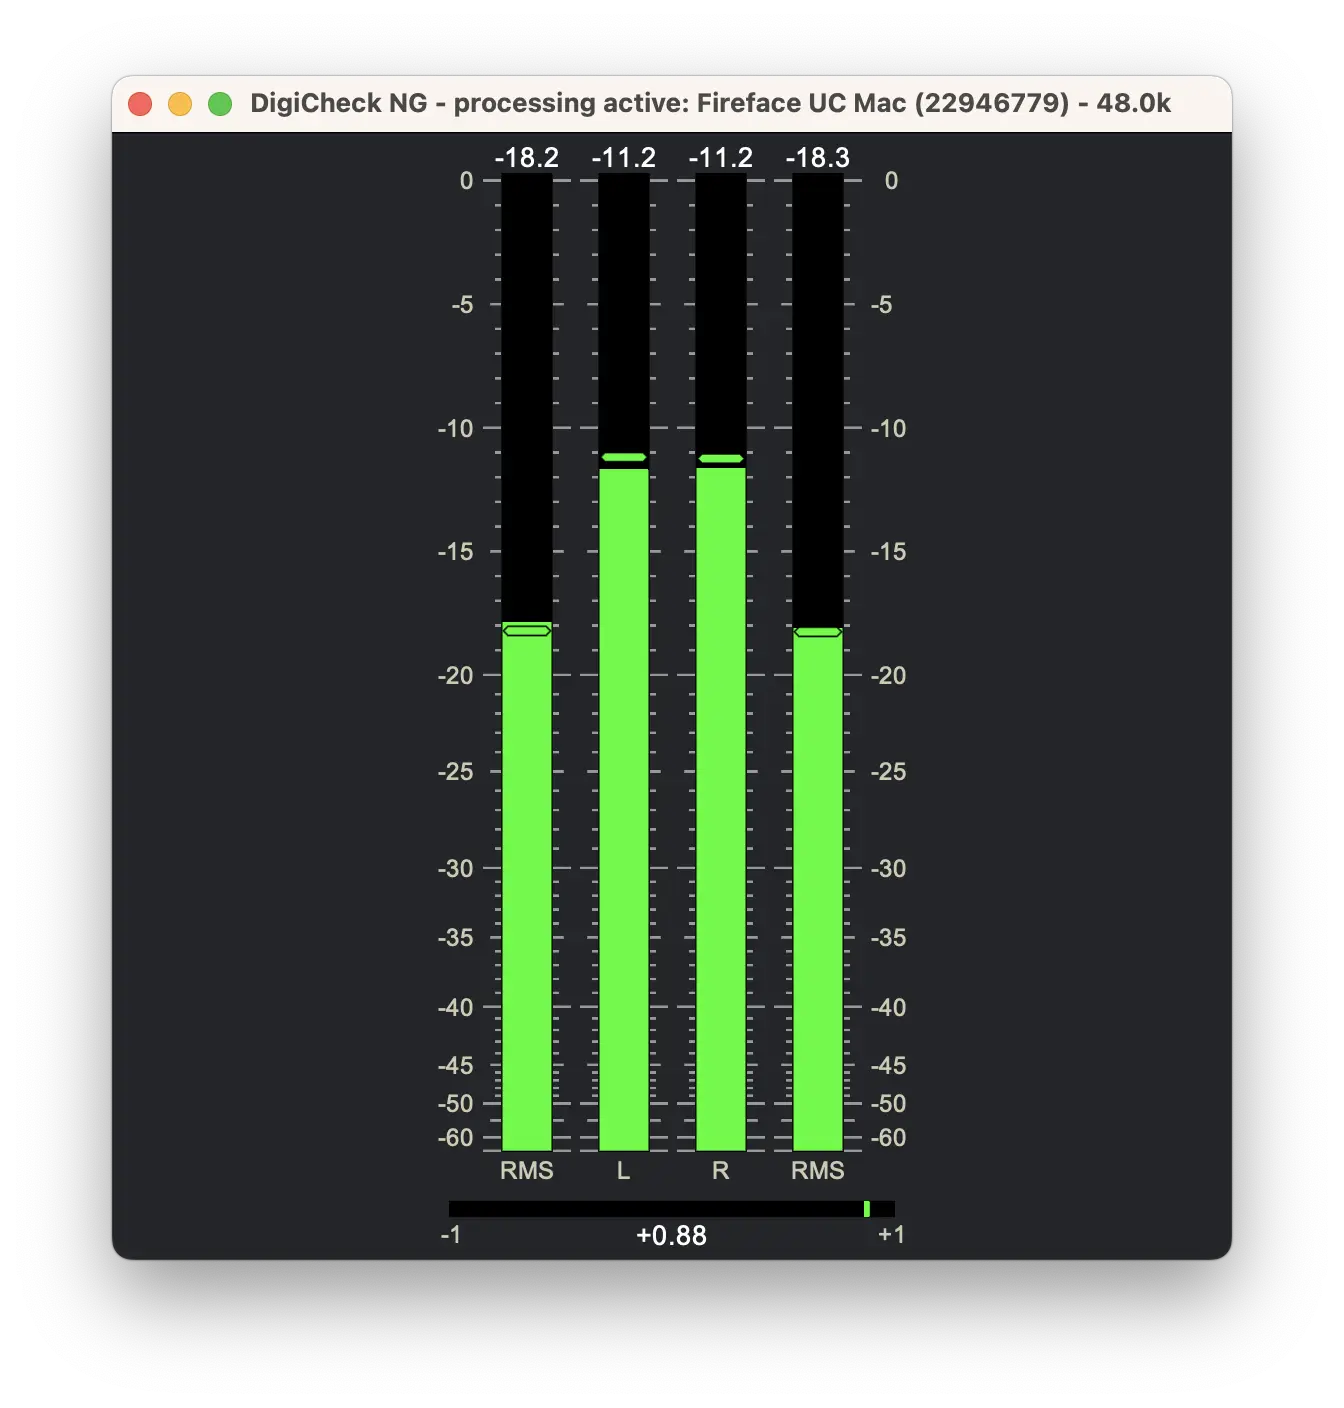
Two channel level meter
This instrument measures the signal levels for two channels and calculates Peak, optionally Intersample Peak (True Peak) and RMS with DC or RLB filter. It also displays various markers for peak hold and RMS with long integration time. You can configure all these functions via numerous options. In addition to the setting parameters of the standard level meters, the Two Channel Level Meter offers the option of displaying the RMS levels in separate bars as well as a phase meter.
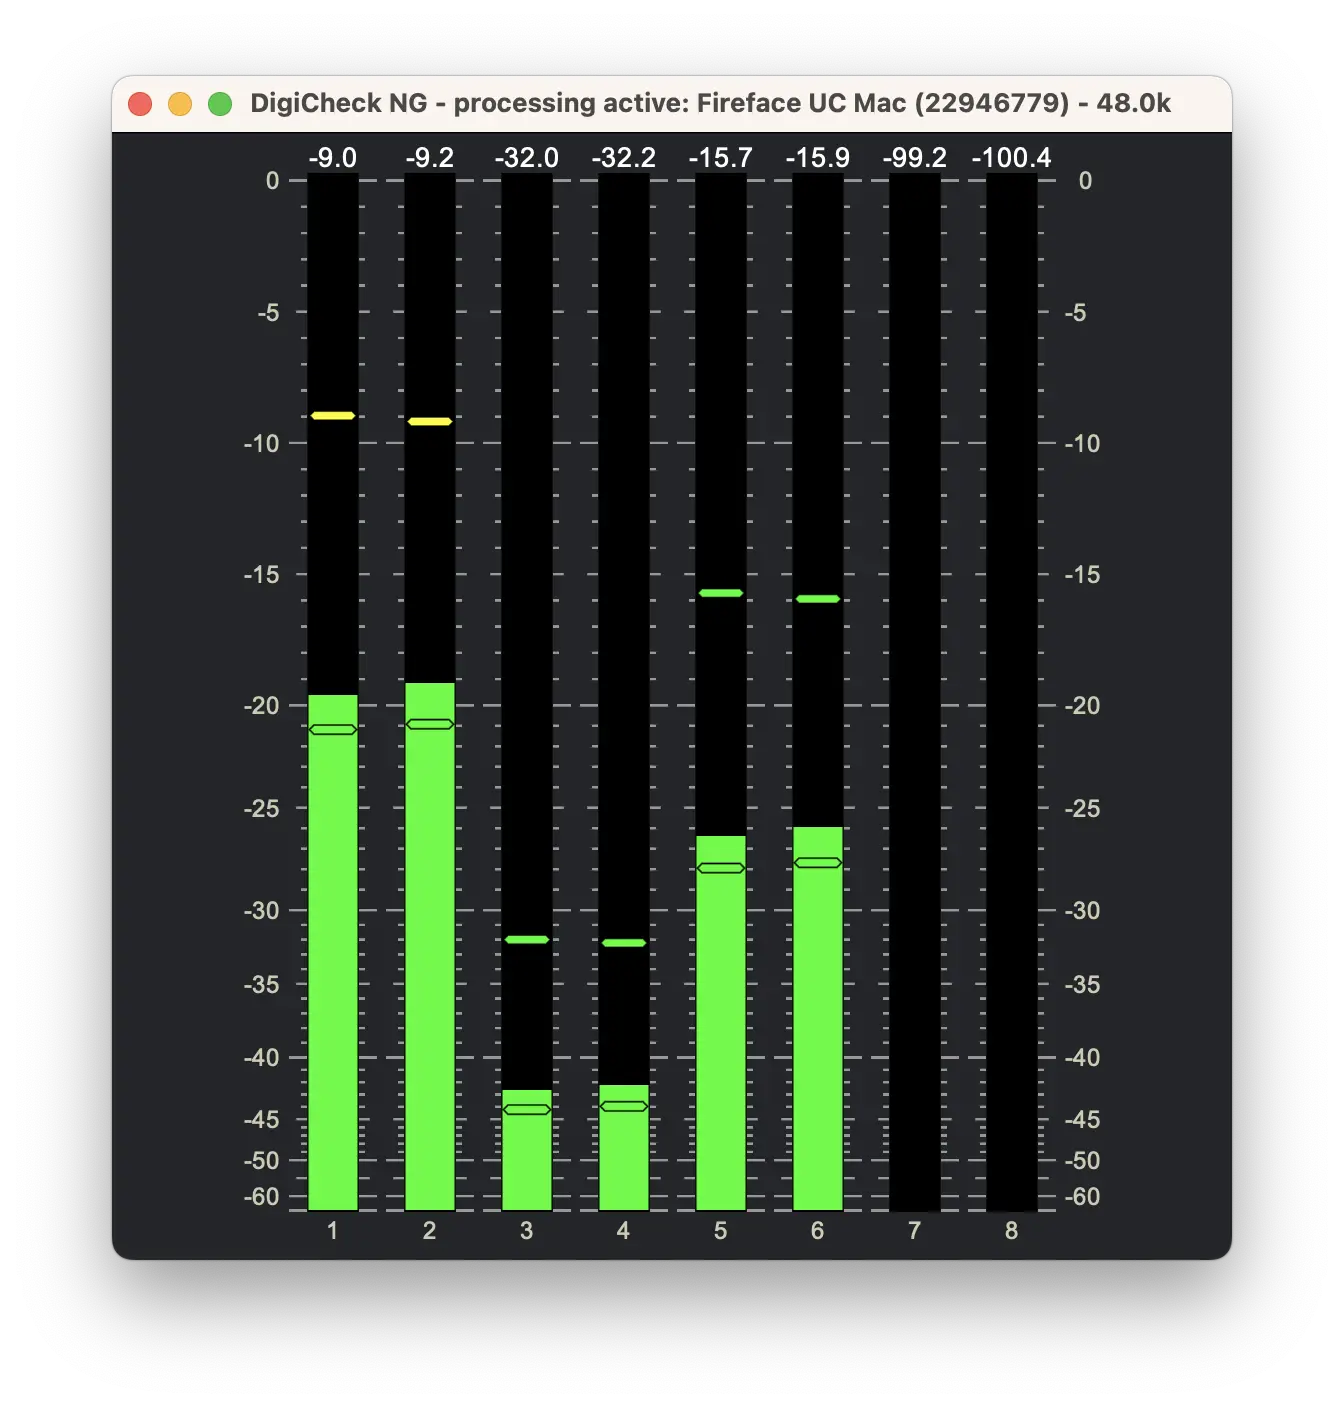
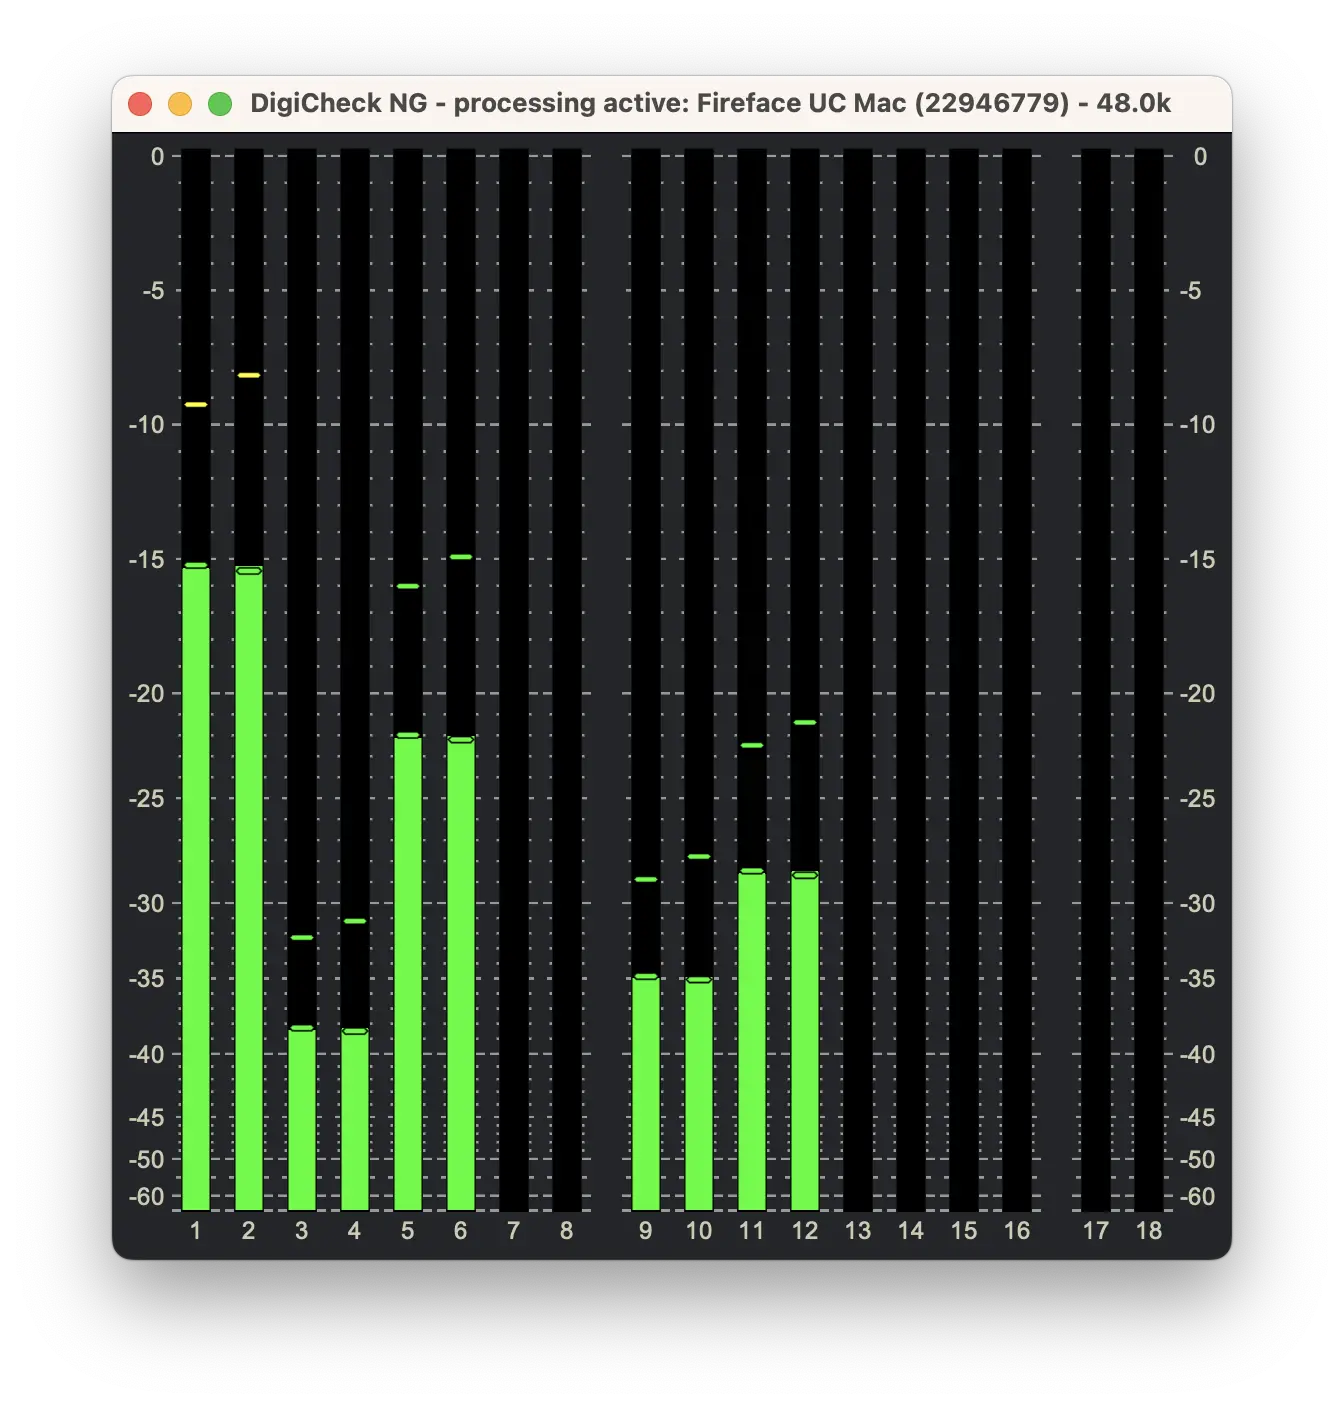
Multi-channel level meter
This instrument is the perfect solution for displaying the levels of numerous channels (up to 32). You can define the number and arrangement of channels however you want, and you can even configure spaces for a better overview.
Global level meter
This tool offers a similarly clear display of the levels of numerous channels as you are familiar with from the Multichannel Level Meter. However, the number of channels always follows the configuration of your audio interface. You can also adjust the spaces in between to get an even better overview.
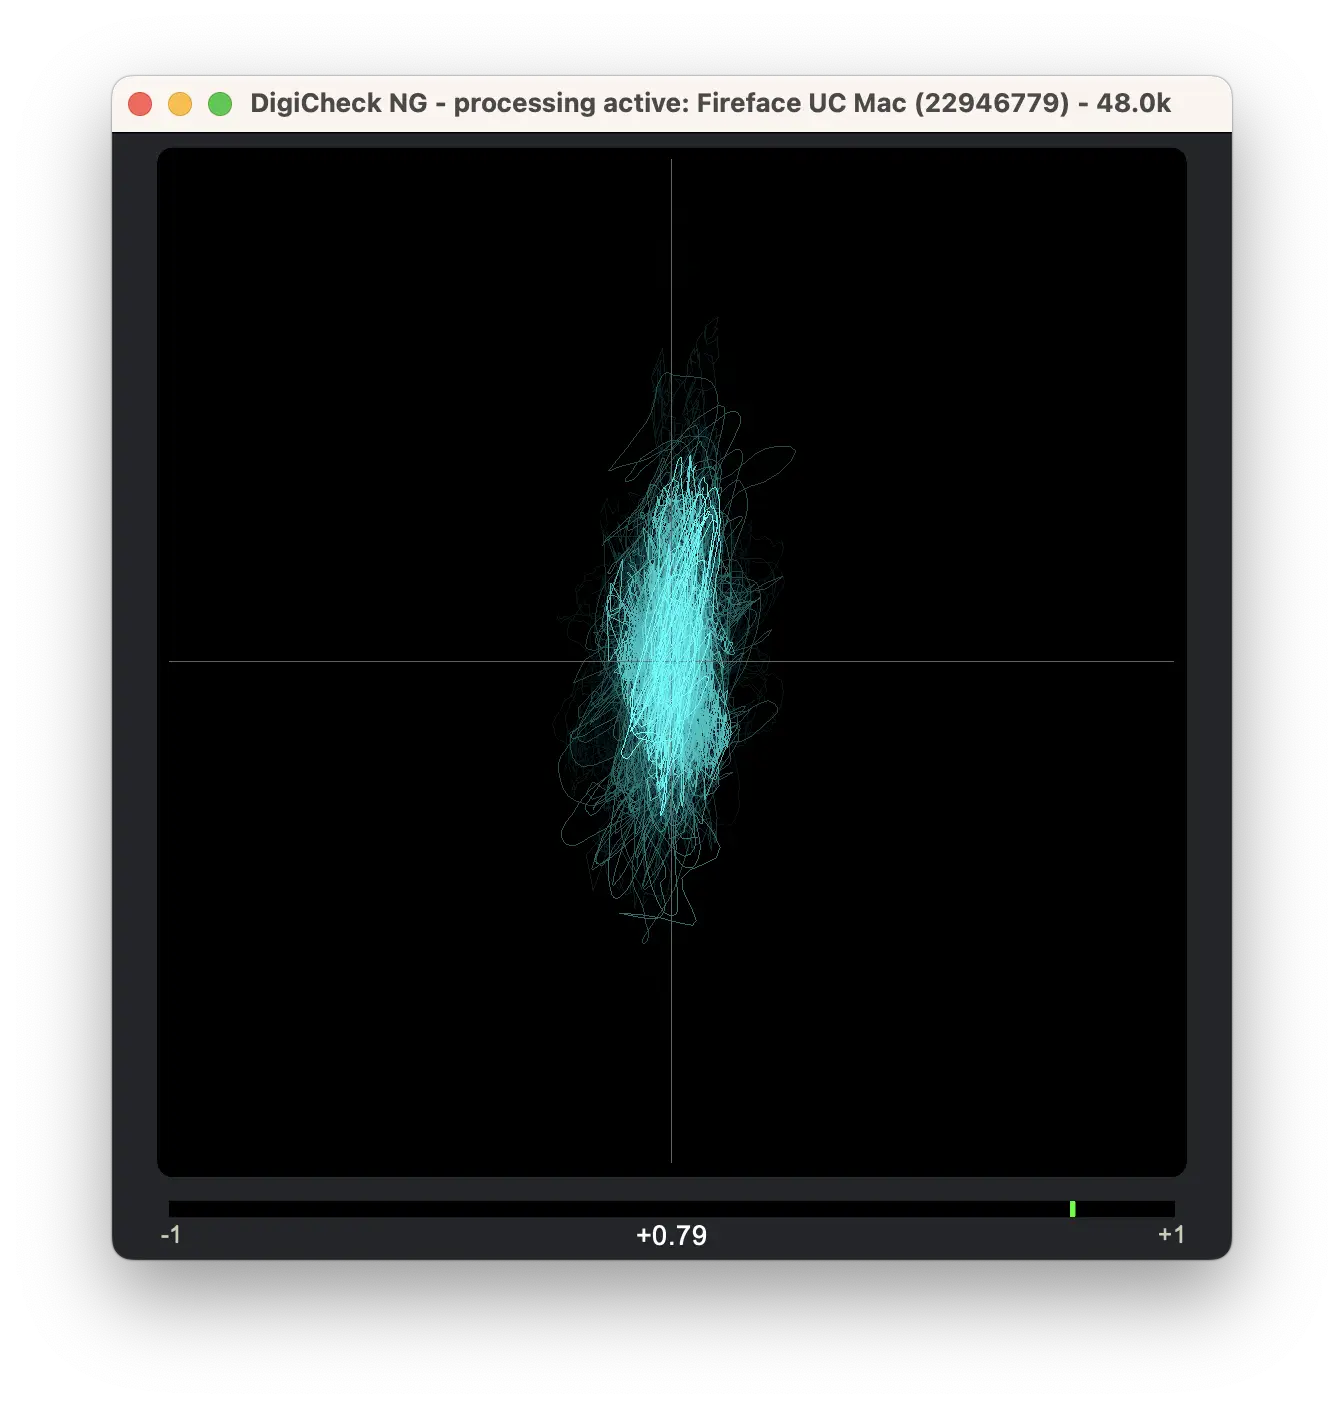
Vector Audio Scope
The Vector Audio Scope (goniometer) is an X-Y recorder with an afterglow function. Without automatic gain control, the result is a rhombus. If both channels have the same signal (mono on 2 channels), you will see a vertical line. If one channel is quieter, it points in the direction of the other channel, up to the diagonal.
If "real" stereo signals are present, the display becomes wider.
The display shows a lot of information, including the amount of compression, phase problems, and balance errors.
You can also activate automatic amplification as an option. If the input signal is smaller than the display range, the gain is slowly increased. If the signal exceeds the display range, the gain is quickly reduced again. This means that even signals with a lower level can be read easily. However, the level reference is lost. The display range expands to the entire square.
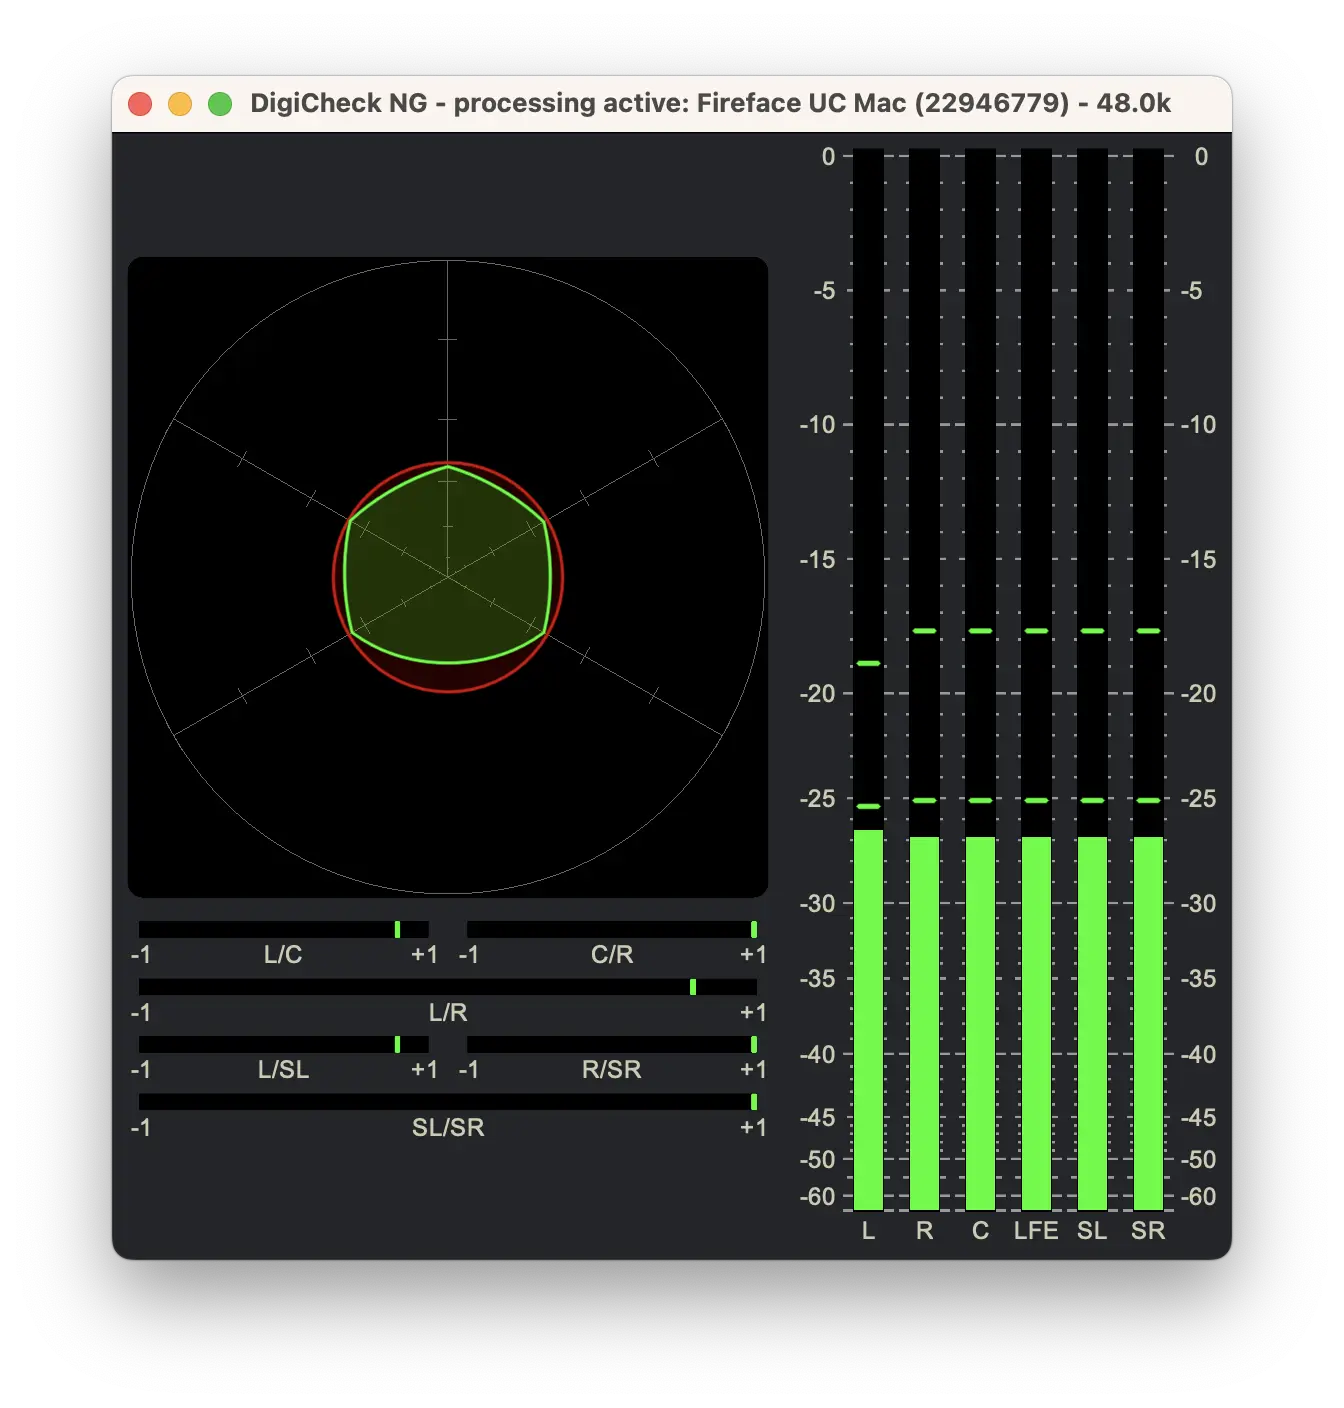
Surround view
The RMS levels of the surround channels show the volume ratios and levels in a circular display. With a weighting filter from the R 128 meter, the volume perception of people can be more accurately represented. The Low Frequency Effect channel is displayed as a circle underneath. No weighting or DC filter is applied to this channel, as this would reduce the display value too much.
Phase meters for the relevant channel pairs are displayed below the figure, as well as level meters for the individual channels.
In the "Input Selection" menu, simply switch off any unused channels to avoid distortion.
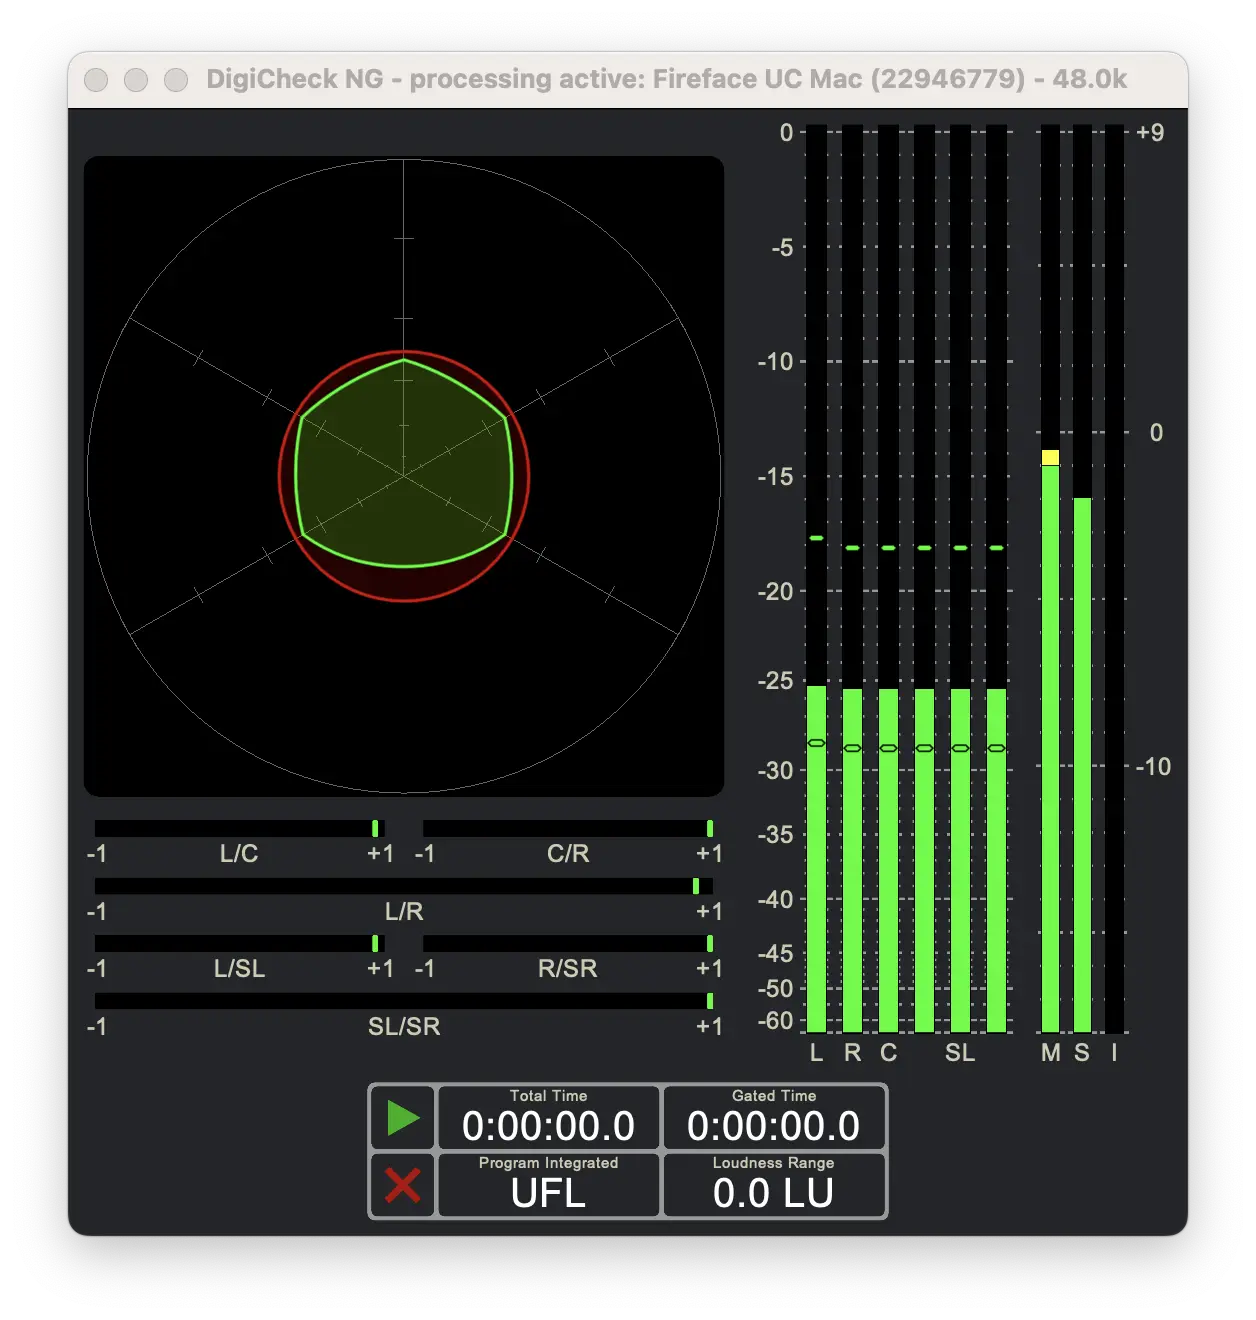
R 128 Loudness meter
This device implements the loudness determination method first described in EBU Recommendation R 128 and now defined in ITU-R BS.1770-4 with regard to signal processing. In simple terms, after filtering in the frequency range, which simulates the human perception of loudness, an RMS determination is carried out in time windows of 400 ms. The RMS value (root mean square) represents the energy of the signals in the individual channels. These signals are weighted and added together according to a predefined scheme for multi-channel measurements. The resulting measured value for 400 ms is displayed as the instantaneous loudness (M). The summation over a period of 3s results in the "short-term loudness" (S). For longer measurements, such as recordings, BS.1770 specifies a statistical evaluation procedure that leads to the "(program) integrated loudness" (I).
Die Ergebnisse werden grundsätzlich in Dezibel angegeben, die in den genannten Dokumenten als Loudness Units („LU“) bezeichnet werden. Diese können sich auf den digitalen Vollaussteuerungspegel („LUFS“) oder auf einen willkürlich festgelegten Bezugspunkt beziehen (-23.0LUFS für 0.0LU bei der EBU, -14LUFS empfohlen bei Spotify). Die EBU empfiehlt zusätzlich 2 Skalen, die optional ausgewählt werden können.
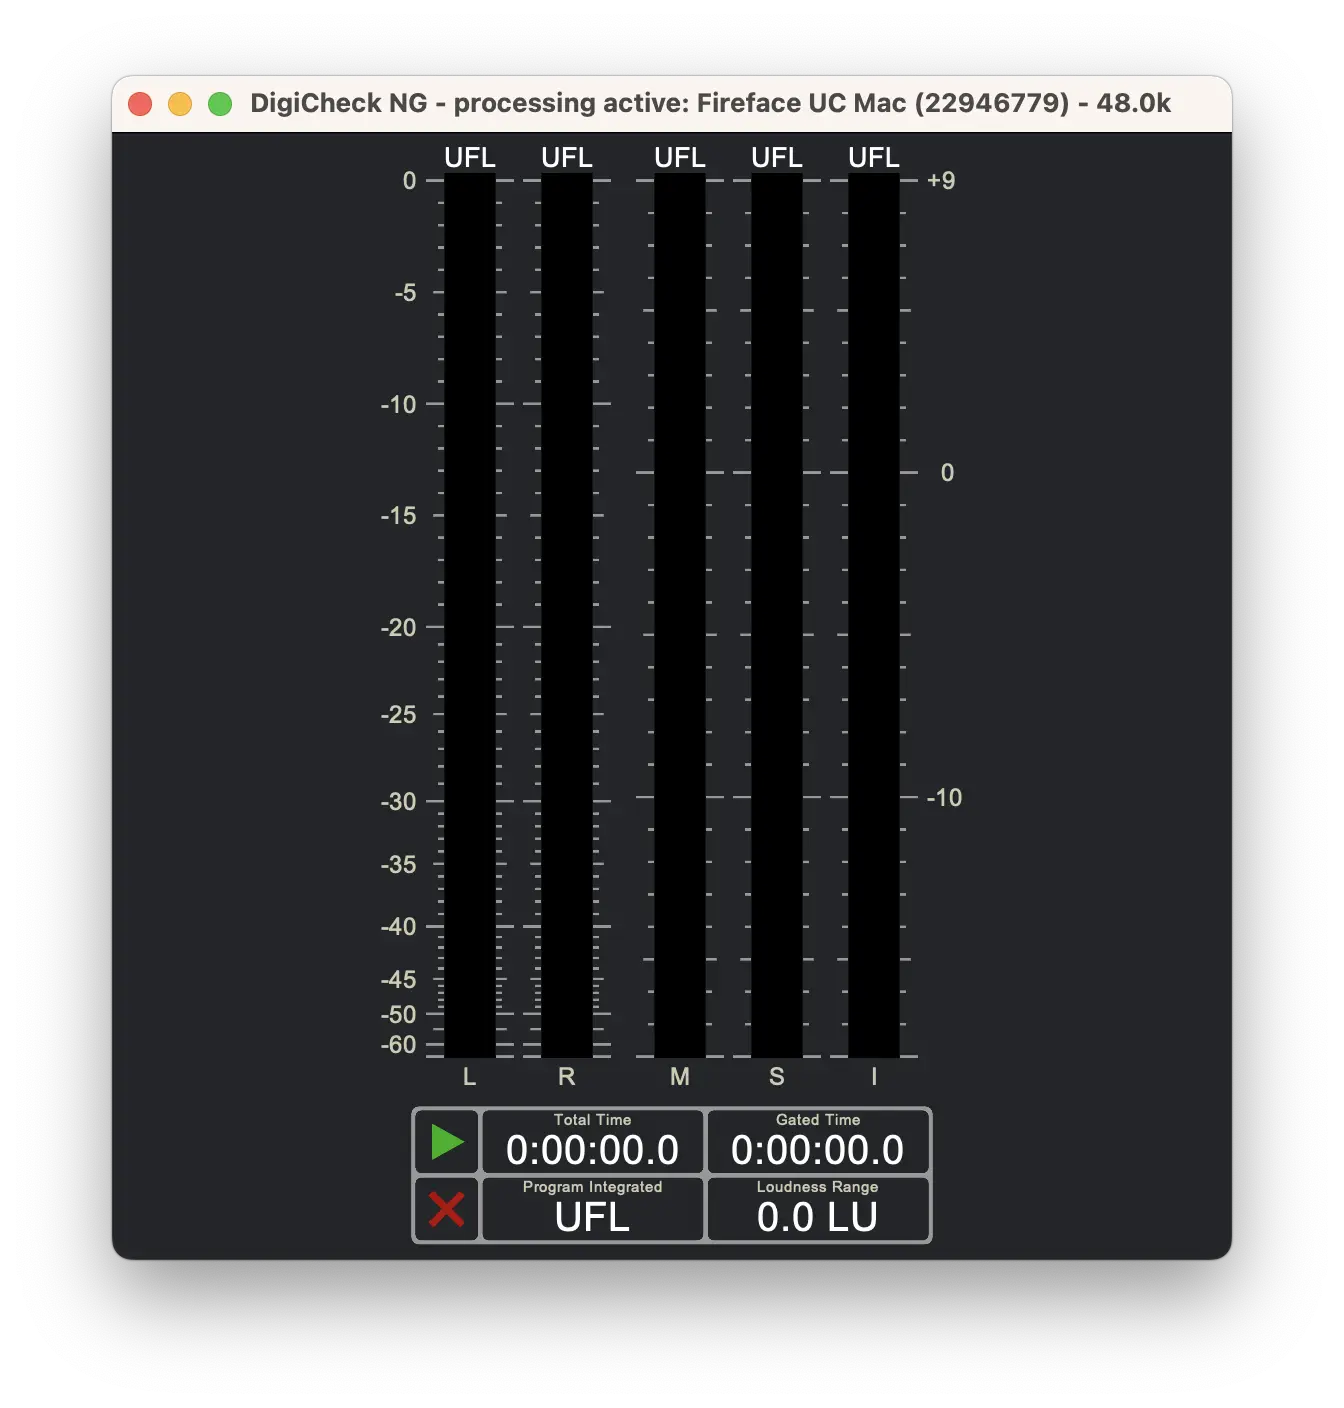
The above recommendations also include inter-sample peak detection. This is achieved by calculating the curve between the samples at several points using a digital filter, which is then used for the peak display. With specially generated test signals, the result can be several decibels above full scale; with highly compressed music, up to 1 dB can be observed.
The inter-sample peak determination can be switched on as an option for all RME DigiCheck level meters. A filter was historically used for this purpose that makes excellent use of the coprocessors (ARM NEON; Intel SSE) and positions one of the additionally calculated samples in the middle between the input samples. Since an update of BS.1770, a special filter is recommended that behaves somewhat differently and may display values that are slightly too low. This filter can be selected in the Preferences menu to obtain exactly comparable results.
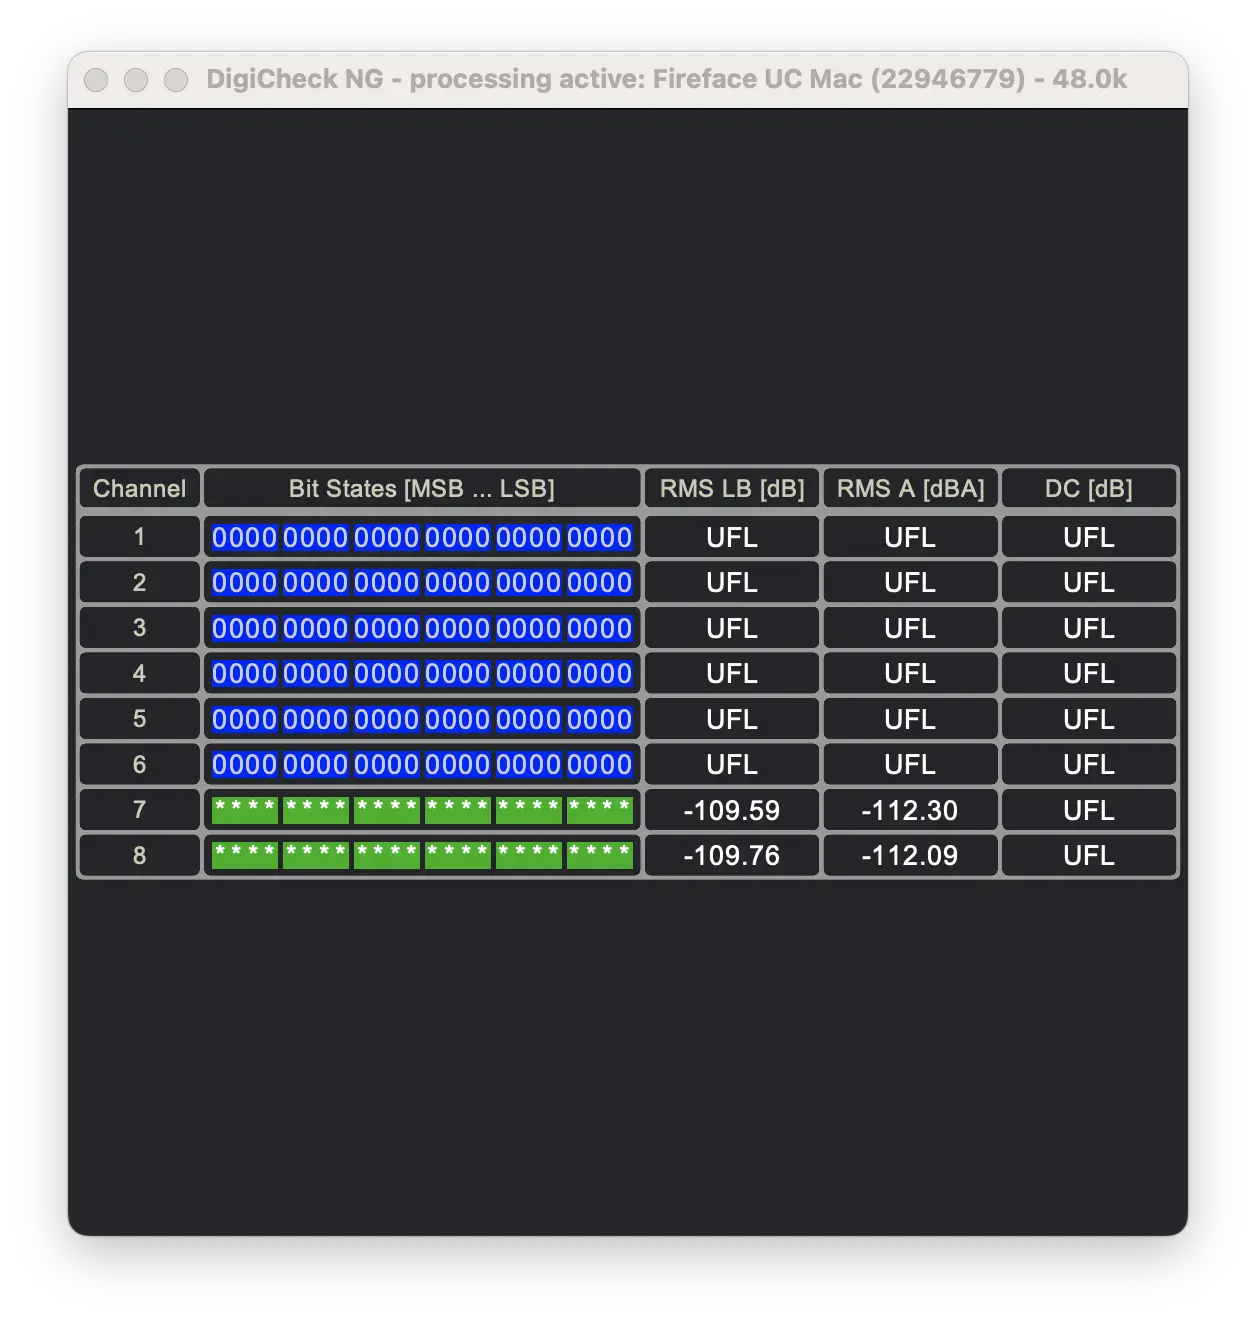
Bit statistics and noise
The bit statistics clearly show whether each bit of the audio data changes (green '*' symbol) or remains at a fixed value (0 or 1). The bits are determined from the 32-bit float data supplied by Core Audio. These have a mantissa of 23 bits and a sign bit, so that in the range -1.0f to +1.0f exactly 24 bits can be represented as integers. This is the resolution of most current audio interfaces and digital interfaces.
Digital signals can of course also have a smaller bit width. In this case, the lower, unused bits remain at zero. If bits remain at 1, this is usually an error in audio signals. It is only with special test signals with high frequencies synchronous to the sampling rate that individual bits can remain at 1. Fixed bit patterns also occur when transmitting DC signals. A mixture of audio signal and DC (as an offset, e.g. with A/D converters without digital high-pass) shows the DC value in the upper bits in the idle state, the lower bits change due to the inherent noise. As the input signal increases, more and more bits change.
The following columns show the input signal level as RMS (Root Mean Square). The first instance is limited to the audio band from approx. 10 Hz to 20 kHz (labeled "LB" for Limited Bandwidth) and the second instance is weighted with the weighting filter type A (labeled dBA). The type A weighting filter simulates the sensitivity of human hearing and is the standard for measuring the signal-to-noise ratio in digital systems. It is usually used in relation to digital full scale.
The last column shows the DC component of the input signal. A steep-edged low-pass filter (two-stage from version 0.90) with downstream slow integration is used for this purpose. The display is in dB in relation to digital full scale (223 - 1). A '+' or '-' indicates the polarity. At very low frequencies, the filter cannot extract a DC signal, so the display values fluctuate greatly.
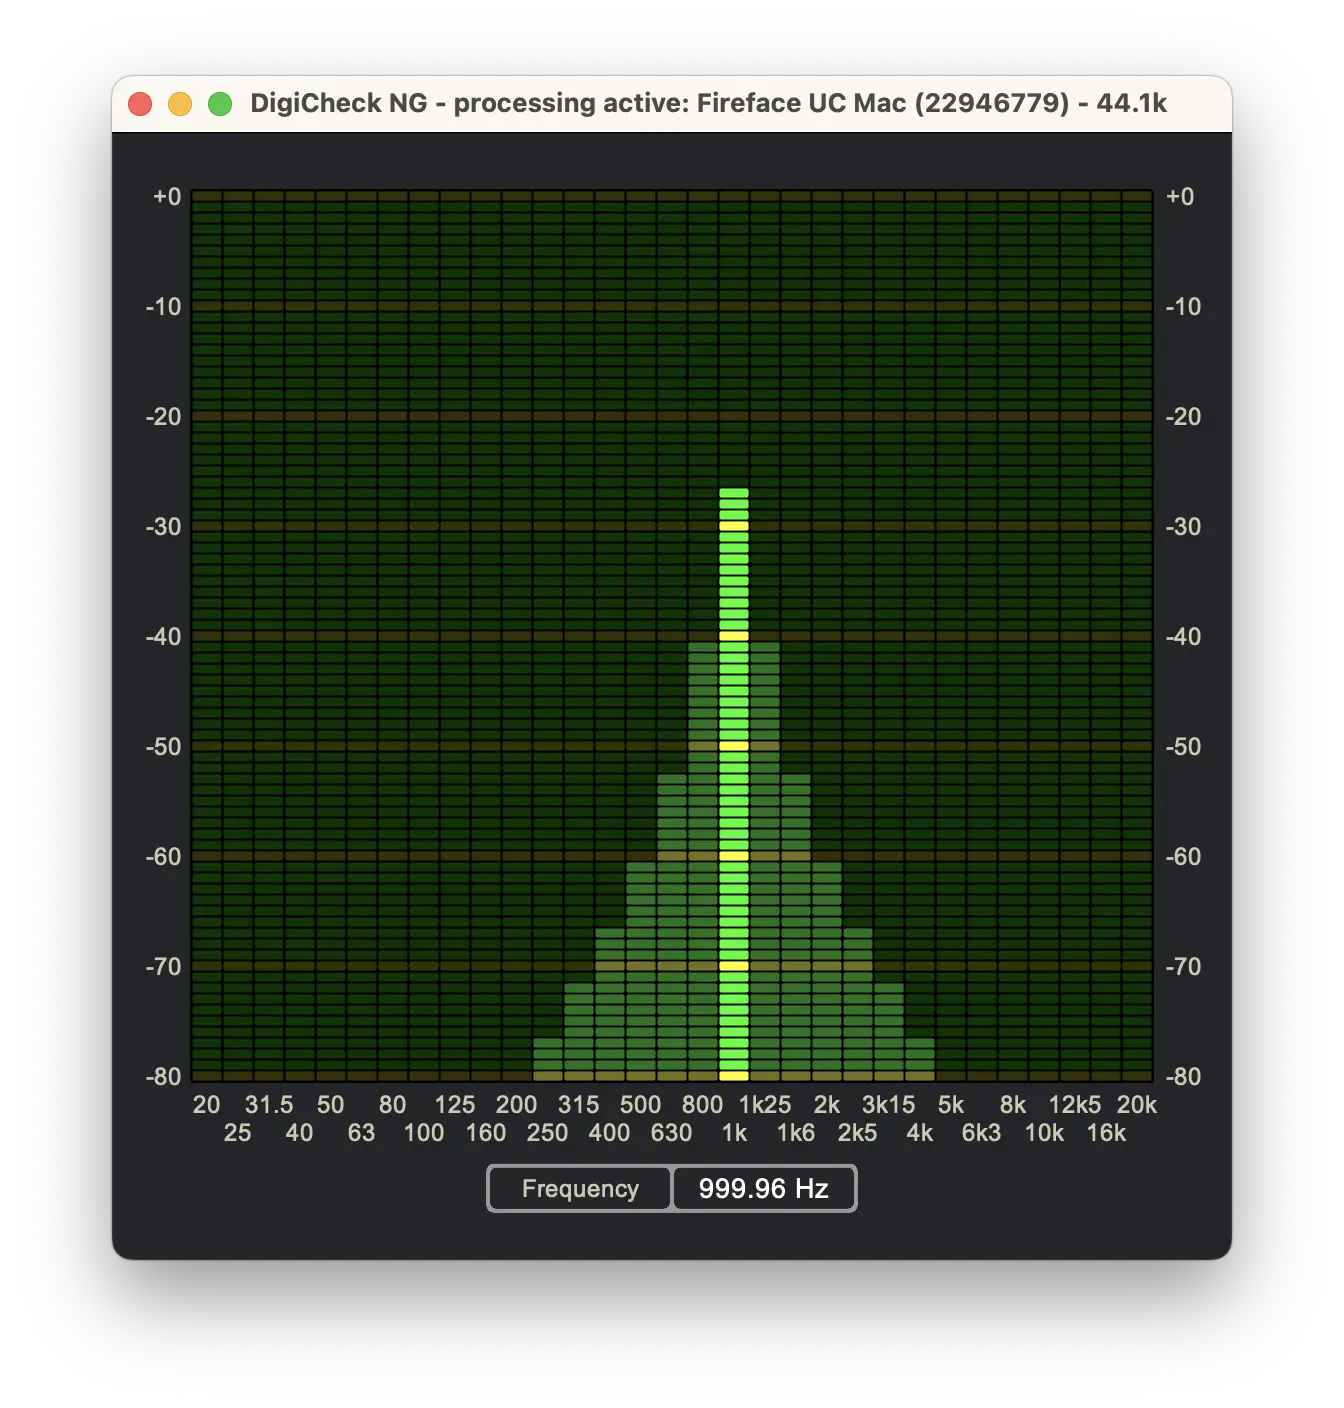
Frequency measurement
The frequency measurement function determines the frequencies in an audio signal. For sine tones, this is their direct frequency. In the case of frequency mixtures, if the frequencies can be separated, the signal component with the largest amplitude is evaluated. The fundamental frequency is searched for or several frequencies are determined, depending on the strategy selected. The function window shows a spectral display in which the evaluated frequency ranges are highlighted.
Frequency measurements on non-pure sine tones are inherently uncertain and the results must be carefully checked for plausibility.